
Market Outlook & Buying Strategy
Week 38 - September 14, 2025

Audience & Purpose
Audience:
This report is designed for container wholesalers, retailers, portable storage companies, freight forwarders, exporters, brokers, and equipment sales/rental firms that depend on container price and supply trends for procurement and inventory planning.
Purpose:
To deliver fact-checked, data-driven insights on global shipping markets, freight rates, and trade flows. Our goal is to help partners make timely, well-informed buying decisions, optimize costs, and build long-term trust with Muwon USA as a reliable supply partner.
Executive Summary
Container freight rates remain under mild downward pressure, particularly on Asia–Europe lanes, while Trans-Pacific routes show slight stability. U.S. imports remain higher than last year but have cooled from July’s peak, and China’s share continues to fall. This week favors proactive inventory building—especially for used units—while monitoring Golden Week impacts before placing additional new-build orders.
Global & Regional Economy
Global: IMF projects 3.0% global GDP growth in 2025. Global PMI stays above 50, confirming moderate expansion. Risks remain: tariffs, geopolitical tension, and energy costs.
United States: Growth is soft but positive; August PPI −0.1% m/m confirms easing inflation pressure. Manufacturing PMI climbed above 53, a constructive sign.
China & Asia: GDP outlook raised to 4.8%; domestic activity stabilizing but U.S.-bound exports fell 10.8% YoY in August, signaling deeper sourcing shifts toward ASEAN partners.
Global Container Shipping Conditions
Drewry WCI (Sep 11): $2,044/FEU, −3% w/w, 13th straight weekly decline.
Asia–Europe: Sharper drops (Shanghai → Rotterdam −10%).
Trans-Pacific: Slightly firmer (Shanghai → LA +6%), supported by GRIs.
Capacity: Blank sailings ahead of Golden Week may tighten space temporarily, but overall supply remains ample.
U.S. Import Volumes
August 2025: 2.52M TEU (+1.6% YoY, −3.9% MoM)
China share: 869k TEU (−10.8% YoY), now ~35% of total imports.
Year-to-date imports are 3.3% ahead of 2024, but growth momentum is slowing.
Market Average Price Snapshot (Retail Level)
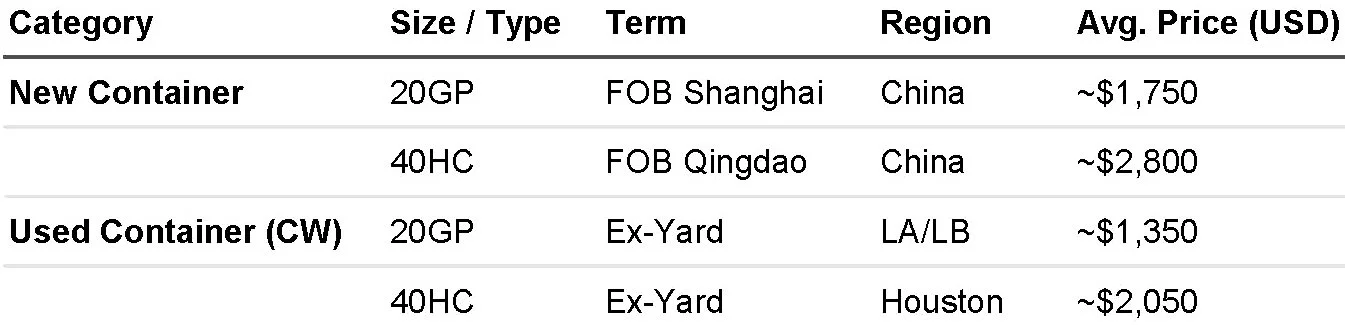
Retail-level reference prices. Wholesale or bulk transaction prices may be more favourable depending on volume, timing, and condition.
Opportunities & Risks
Opportunities
Build used inventory now while prices and repositioning costs are low.
Promote early Q4 bookings and flexible lease options to lock in volume.
Highlight reduced landed costs to customers as a buying incentive.
Risks
Tariff changes or geopolitical flare-ups could disrupt flows unexpectedly.
Prolonged rate weakness may trigger capacity cuts or sudden GRIs.
Golden Week blank sailings could create short-term schedule pressure.
Recommended Buying Strategy
Used Containers: Buy now, secure 2–4 weeks of buffer stock.
New Builds: Place targeted orders where lead time is critical; defer discretionary purchases until post-Golden Week rate direction is clear.
Customer Engagement: Lead with data — show freight savings, offer flexible delivery/lease terms, and position Muwon USA as a trusted market advisor.
What’s Changed Since Last Week (Sep 7)
Rates: Composite WCI continued to slide; Asia–Europe weakness more pronounced than previously reported.
Imports: August TEU figures confirm a peak in July and faster-than-expected decline in China’s share.
Macro: U.S. PMIs improved and inflation eased — slightly stronger backdrop but insufficient to reverse rate softness yet.
References
Drewry World Container Index, Sep 11, 2025
Descartes Global Shipping Report, Sep 9, 2025
IMF World Economic Outlook Update, Jul 2025
Reuters, U.S. container imports up in August, Sep 9, 2025

* Inventory as of September 14, 2025