
Market Outlook & Buying Strategy - February 2026
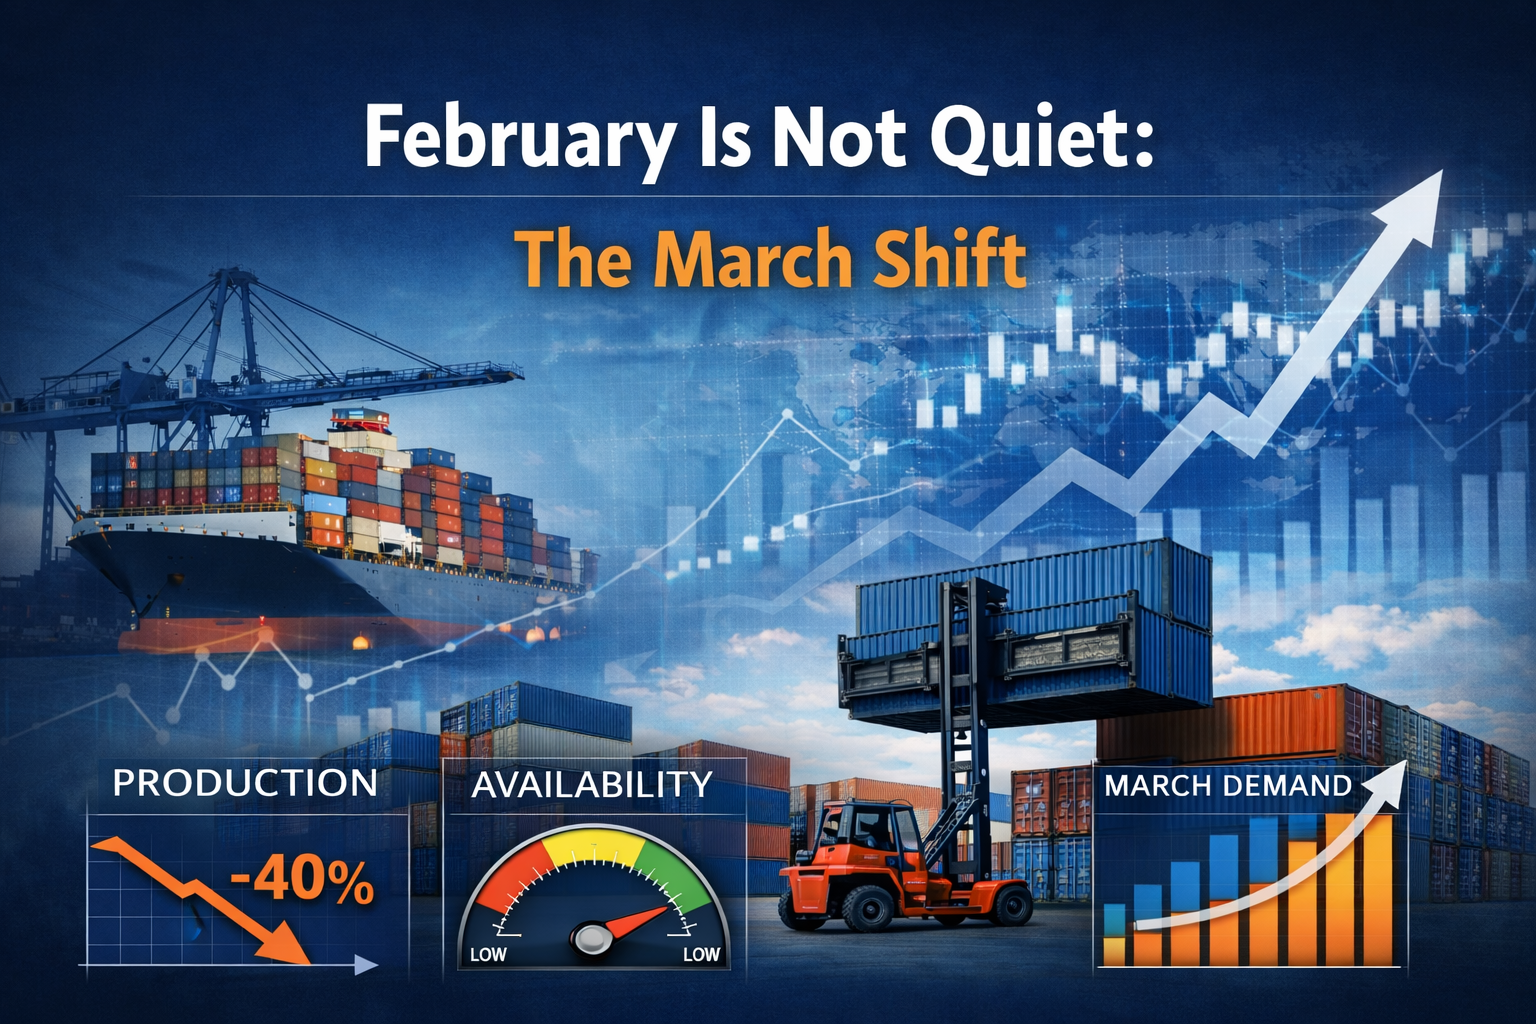
February Is Not Quiet: Quantified Signals Behind the March Shift in the North American Container Market
North America Container Market Insights | February Edition
Executive Insight
February is widely perceived as a transitional month. Factory production data and post–Lunar New Year (LNY) operating plans indicate otherwise.
I. February in Numbers: Production Reality After Lunar New Year
Table 1. China Container Production Snapshot
| Item | January 2026 (Actual) | February 2026 (Planned) | Change |
|---|---|---|---|
| Total Production (TEU) | ≈ 567,000 | ≈ 320,000 – 360,000 | ▼ ~35–45% |
| Dry Containers | ≈ 523,000 | ≈ 290,000 – 320,000 | ▼▼ |
| Reefer Containers | ≈ 44,000 | ≈ 30,000 – 35,000 | ▼ |
| New Order Intake | Low (pre-LNY backlog only) | Very limited / near-zero | ▼▼ |
Source: CT_NB_2026 (up to Jan), Factory Info 202602, February production plans. January reflects pre-LNY backlog clearing; February reflects deliberate production restraint.
Raw Material Prices: Stability Without Expansion
| Input | Late Jan 2026 Level | MoM Direction | Market Implication |
|---|---|---|---|
| Steel (Corten) | ≈ RMB 4,200–4,250 / ton | ▲ +RMB 40–50 | No incentive for aggressive output |
| Plywood | ≈ RMB 1,900–2,000 / m³ | Flat | Cost stability ≠ volume expansion |
| Paint & Coatings | Stable | Flat | Marginal impact on production decisions |
Source: MATERIAL PRICE.xlsx, factory interviews, late January data.
II. How to Operate During February
Buying Strategy
With February production down roughly 40% from January, the primary risk is not price volatility but execution failure.
- Prioritize confirmed production slots and depot release timing
- Avoid contracts relying on “March improvement” assumptions
- Screen inventory by location + condition + timing first
Selling Strategy
February is when buyers quietly evaluate supplier reliability for Q2.
- Narrow delivery windows
- Conservative availability representation
- No over-commitment on post-LNY recovery
III. What Changes in March: Quantified Behavioral Shift
| Factor | February | March |
|---|---|---|
| Buyer Order Size | Minimal / selective | Small but frequent |
| Inventory Motivation | Observation | Minimum coverage |
| Availability (Good Units) | Appears adequate | Tightens rapidly |
| Price Reaction | Flat | Lagging |
IV. Availability Before Price: Structural Lag
Lunar New Year
→ Factory restart discipline
→ Production slot prioritization
→ 4–8 week export & release lag
→ March inventory positioning
→ North America availability tightening
This mechanism does not require strong demand. It only requires many buyers deciding not to hold zero inventory.
Closing Insight
February is not a waiting month. It is a positioning month.
This analysis reflects factory data, production plans, and material price information available as of late January 2026. It is intended for operational risk management and strategic planning purposes only.