
2026 U.S. Container Market Outlook
Muwon USA, Inc. · Strategy Planning Office
2026 U.S. Container Market Outlook
Evidence-Based Structural Analysis and Strategic Implications
Executive Summary
The U.S. container market entering 2026 is transitioning into a post-distortion normalization phase, following the extreme volatility of 2020–2022 and the prolonged correction throughout 2023–2024. Quantitative indicators suggest downside risk has materially diminished, yet the market lacks the structural tightness required for a broad price upcycle.
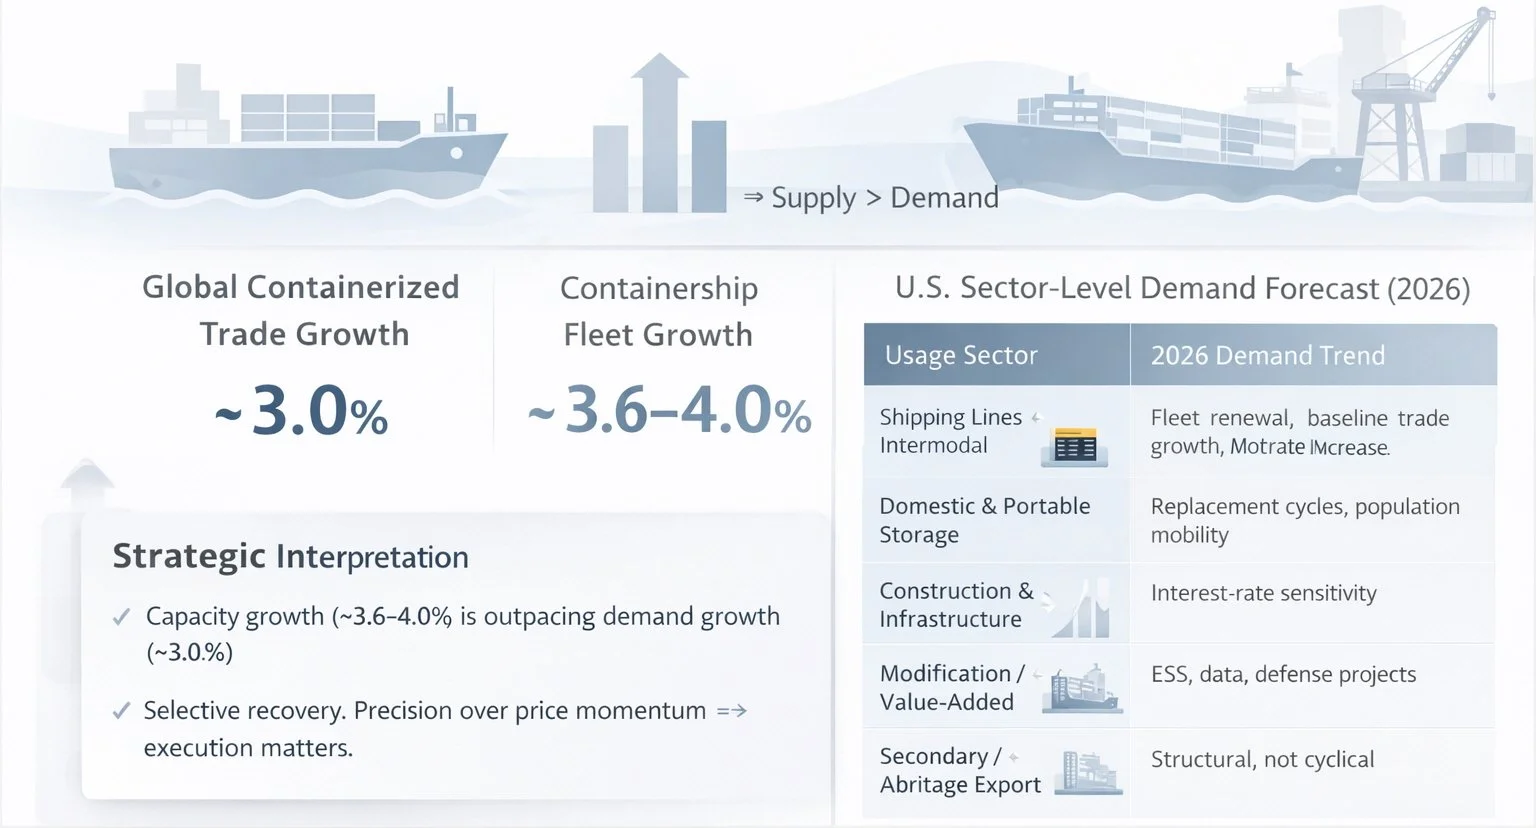
Industry forecasts broadly indicate global containerized trade growth around ~3% in 2026, while global containership fleet capacity growth is expected to remain higher (roughly 3.6–4.0%). This persistent gap structurally limits freight rate and asset price upside and reinforces a market defined by selective demand recovery, quality differentiation, and execution discipline.
A year where outcomes are driven less by price momentum and more by operational judgment, inventory quality, and execution speed.
I. Macro, Political, and Monetary Environment
U.S. Election Cycle and Business Behavior
U.S. presidential election cycles typically increase near-term uncertainty. In practice, capital-intensive segments (logistics, infrastructure, and project-based procurement) often defer large commitments until policy direction becomes clearer. For container demand, election-year effects are generally neutral to mildly stabilizing, rather than strongly expansionary.
Interest Rates and Demand Transmission
Potential Federal Reserve easing—if it occurs—should be interpreted primarily as a stabilizing development. The transmission into physical trade flows typically carries a multi-quarter lag. The near-term effect is largely psychological: financing conditions stop deteriorating, deferred decisions re-open, and risk tolerance improves marginally. This supports baseline normalization rather than speculative expansion.
II. Global Shipping and Fleet Capacity Dynamics
Fleet Growth vs. Trade Growth
The defining structural factor for 2026 is that supply growth is still expected to outpace demand growth, even after scrapping and idling are considered. This dynamic constrains freight rate upside and reinforces disciplined inventory behavior among shippers.
| Indicator (Global) | 2026 Projection (Working Range) | Strategic Interpretation |
|---|---|---|
| Containerized trade growth | ~2.8% to 3.2% | Moderate, supportive of baseline volumes |
| Containership fleet capacity growth | ~3.6% to 4.0% | Supply remains structurally sufficient |
| Net balance | Supply > Demand | Limits broad-based price upcycle |
Note: These figures are industry-forecast ranges used for strategic framing (e.g., Drewry/Xeneta/Clarksons-type market outlooks). Update with the latest release if publishing with citations.
Route Normalization and Efficiency Effects
If major route disruptions (including Suez-related inefficiencies) ease, transit reliability improves and cycle times shorten. Higher utilization efficiency can reduce the number of containers required per unit of cargo moved—often offsetting part of the demand uplift from trade growth. Therefore, route normalization is operationally positive but not automatically bullish for total container asset demand.
III. Demand Fundamentals: Replacement Before Expansion
Replacement and Replenishment Demand
A core pillar entering 2026 is replacement demand accumulated during 2023–2024, when many end-users deferred upgrades to preserve liquidity. As operating conditions stabilize, replacement becomes unavoidable: it is non-discretionary and less sensitive to short-term price moves.
Institutional Procurement Behavior
Increased interest in newbuild and one-trip procurement by large operators is best interpreted as risk containment: predictable depreciation, reduced lifecycle uncertainty, and standardized fleet quality. This is not the same as speculative accumulation.
What Is Not Returning
Broad-based speculative buying remains limited. Many buyers continue to prioritize staged purchasing, immediate deployability, and clear end-use visibility. Lower-grade used containers face structural demand weakness as total cost of ownership becomes a more dominant decision factor.
IV. Supply and Pricing Dynamics by Container Type
| Container Type | 2026 Price Bias | What Drives the Bias |
|---|---|---|
| Newbuild | Stable / Range-bound | Cost floor supported by materials; ample manufacturing capacity limits upside |
| One-Trip | Slightly Firm | Strong preference for quality + availability, especially inland markets |
| Cargo-Worthy (CW) | Selective Firming | Highly dependent on location, condition, and immediate usability |
| Lower-Grade Used | Weak | Structural oversupply persists; limited scalable secondary applications |
In practical terms, 2026 remains a differentiated market: quality and positioning matter more than generalized “market strength.” This favors disciplined procurement and fast turnover over long-hold strategies dependent on price appreciation.
V. U.S. Demand Outlook by Usage Sector (2026)
| Usage Sector | 2026 Demand Trend | Primary Drivers |
|---|---|---|
| Shipping Lines / Intermodal | Stable → Firm | Fleet renewal, baseline trade growth, operational replacement cycles |
| Domestic & Portable Storage | Moderate Increase | Replacement cycles, population mobility, seasonal uplift (spring–summer) |
| Construction & Infrastructure | Weak → Slightly Softer | Rate sensitivity, project timing, approval delays |
| Modification / Value-Added | Firm (Selective) | ESS, data infrastructure, defense/industrial projects (spec-driven) |
| Secondary / Arbitrage Export | Weak / Declining | Tactical windows only; higher volatility; limited structural support |
Sector Commentary
Shipping & Intermodal procurement is predominantly non-discretionary and stabilizes base throughput. Storage remains one of the most dependable absorbers of CW units, particularly inland. Construction is episodic and price-sensitive. Modification is smaller in volume but attractive in margin if specifications and timing are managed precisely. Arbitrage should be treated as tactical rather than strategic.
VI. Strategic Focus for Muwon USA
| Sector | Priority | Strategic Role |
|---|---|---|
| Shipping / Intermodal | High (Defensive Core) | Volume stability, forecastable deployment |
| Domestic Storage | High (Operational Core) | Turnover engine and CW absorption base |
| Modification / Value-Added | Selective High | Margin differentiation and strategic partnerships |
| Construction | Opportunistic | Outlet for lower-grade inventory |
| Arbitrage / Export | Low | Volatility without durable demand base |
“2026 is not the year when prices dominate the market. It is the year when execution and judgment determine performance.”
Notes & Disclaimer
This report is prepared by Muwon USA, Inc. for informational and strategic discussion purposes only. The analysis is based on a combination of publicly available market research, industry-standard forecasts (including shipping, fleet, and trade data), and internal market interpretation as of the time of writing.
All projections and assessments herein represent forward-looking interpretations rather than guarantees of future performance. Market conditions, pricing, and supply-demand dynamics may change materially due to factors beyond the control of the author.
This document does not constitute investment advice, pricing guidance, or a solicitation to buy or sell assets. Readers are encouraged to conduct their own due diligence and consult independent advisors before making commercial or investment decisions.